

Cosmology / Elementary Tour part 1: The expanding universe
Together, billions and billions of stars like our sun form gigantic star systems – galaxies like our own Milky Way galaxy, which probably doesn’t look all that different from the galaxy NGC 4414 shown here:
")
Hubble-Aufnahme der Spiralgalaxie NGC 4414
© Hubble Heritage Team (AURA/STScI/NASA)
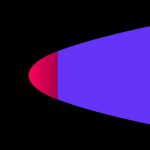
The cosmological models of general relativity paint a rather simple picture of a universe filled with a collection of such galaxies freely drifting through space. These galaxies are evenly distributed, and they drift in an orderly way, following the expansion of space. This expansion is shown in the following animation. The animation depicts part of a two-dimensional slice of the universe, including a number of galaxies, and it is certainly not to scale; all distances and sizes are chosen for easy viewing, not for verisimilitude.
The animation shows 100 million years worth of the expansion of the universe, as seen from our own galaxy (shown in red) which, as our personal reference point, remains firmly in the centre. Time is shown in the upper left corner (where “My” stands for “million years”), and the galaxies visibly move away from our own. The distances from our galaxy to the blue and green galaxies (measured in light years, abbreviated ly) are shown at both the beginning and the end of the animation. At the end of the brief clip, we see that the distances to the blue and green galaxies have doubled, and so have all distances between all of the galaxies shown!

The expansion of the universe
For each galaxy, the average speed with which it recedes from our own red galaxy is the distance it covers, divided by the time it needs for its motion. To calculate the distance covered by the green galaxy, we compare its distance from the red galaxy at the beginning (1 million ly) to the distance at the end of the observation period (2 million ly). We thus find that during the 100 million years shown in the animation, its distance has increased by a million light years, corresponding to an average speed of
| v = 1 million light years/100 million years | = 0.01 light years/year = 3000 kilometres/second |
On the other hand, for the blue galaxy with its initial distance of two and its final distance of four million light years, corresponding to an increase by 4-2=2 light years, we obtain
| v = 2 million light years/100 million years | = 0.02 light years/year = 6000 kilometres/second. |
This illustrates a direct consequence of cosmic expansion: the speed with which a galaxy recedes from us is directly proportional to its initial distance – double distance, double speed, in our example. This is called the Hubble relation: the further a galaxy is away from us, the faster it recedes.
Finally, a caveat. There’s one aspect of cosmic expansion that the animation above cannot show: In this expansion, the points of view of all the galaxies are equally valid. Had we chosen a different galaxy to form the immobile center point of our animation, the animation would look just the same, all galaxies moving away from the observer, and their average speeds and distances following the same Hubble relation as above – double distance, double speed. The expansion has no center: all distances increase by the same factor, and every observer on a galaxy sees the same expanding cosmos.
Further Articles
 A tale of two big bangs
 Cosmic Sound: Curvature and the cosmic background radiation
 Relativity and the Quantum / Elementary Tour: Conclusion
 Relativity and the Quantum / Elementary Tour part 4: Loop quantum gravity
 Relativity and the Quantum / Elementary Tour part 3: The need for quantum gravity
 Relativity and the Quantum / Elementary Tour part 2: Evaporating black holes?